
Στις 2 Μαρτίου, η Ευρωπαϊκή Επιτροπή δημοσίευσε ένα roadmap αξιολόγησης της Οδηγίας Ταχυδρομικών Υπηρεσιών. Η Επιτροπή χρησιμοποιεί roadmap για να καθορίσει το πεδίο εφαρμογής αξιολόγησης των υφιστάμενων ή των νέων πολιτικών, να περιγράψει το πρόβλημα και να εξηγήσει γιατί απαιτείται δράση της ΕΕ.
Η Οδηγία Ταχυδρομικών Υπηρεσιών (Postal Services Directive, PSD) θέσπισε κανονιστικό πλαίσιο για τις Ευρωπαϊκές Ταχυδρομικές Υπηρεσίες. Στον πυρήνα της βρίσκεται η Universal Service Obligation (USO), η οποία εξασφαλίζει ότι οι επιστολές και τα δέματα παραδίδονται κατ’ οίκον ή στους επαγγελματικούς χώρους, πέντε ημέρες της εβδομάδας σε κάθε χώρα της ΕΕ.
Η Οδηγία αποσκοπούσε στη δημιουργία μιας εσωτερικής αγοράς για τις ταχυδρομικές υπηρεσίες μέσω σταδιακής απελευθέρωσής της, διασφαλίζοντας ταυτόχρονα ότι όλοι στην ΕΕ είχαν πρόσβαση σε ένα ελάχιστο σύνολο υπηρεσιών (παράδοση επιστολών και δεμάτων έως 20 κιλά) σε μια λογική τιμή. Συγκεκριμένα, η Οδηγία για τις Ταχυδρομικές Υπηρεσίες προσδιορίζει τις ελάχιστες απαιτήσεις της universal service, που πρέπει να εξασφαλίζει κάθε κράτος μέλος της ΕΕ, και τις ισχύουσες αρχές τιμολόγησης, καθώς επίσης ενθαρρύνει την τεχνική εναρμόνιση στον τομέα της ταχυδρόμησης.
Από την τελευταία αναθεώρηση του 2008, ο τομέας των ταχυδρομείων έχει υποστεί μεγάλες αλλαγές λόγω της ψηφιοποίησης και του ηλεκτρονικού εμπορίου. Αυτό οδήγησε σε σταθερή μείωση του επιστολικού ταχυδρομείου, η οποία δεν αντισταθμίζεται εξ ολοκλήρου από την ανάπτυξη της αγοράς των δεμάτων. To εν λόγω roadmap θα αξιολογήσει κατά πόσο η Οδηγία είναι ακόμη κατάλληλη για το σκοπό για τον οποίο δημιουργήθηκε και κατά πόσο επιτυγχάνει τους αρχικούς της στόχους.
Η περίοδος υποβολής προτάσεων για την αξιολόγηση της ντιρεκτίβας λήγει στις 30 Μαρτίου. Το Ecommerce Europe θα αξιολογήσει το roadmap και θα συντάξει την αναφορά του. Επιπλέον, το Ecommerce Europe εξακολουθεί να συμμετέχει σε διάφορες ομάδες εργασίας και workshop της Ευρωπαϊκής Επιτροπής, που εστιάζουν σε αυτό το θέμα.
[social_share googleplus="no" linkedin="yes" whatsapp="no" viber="no"]
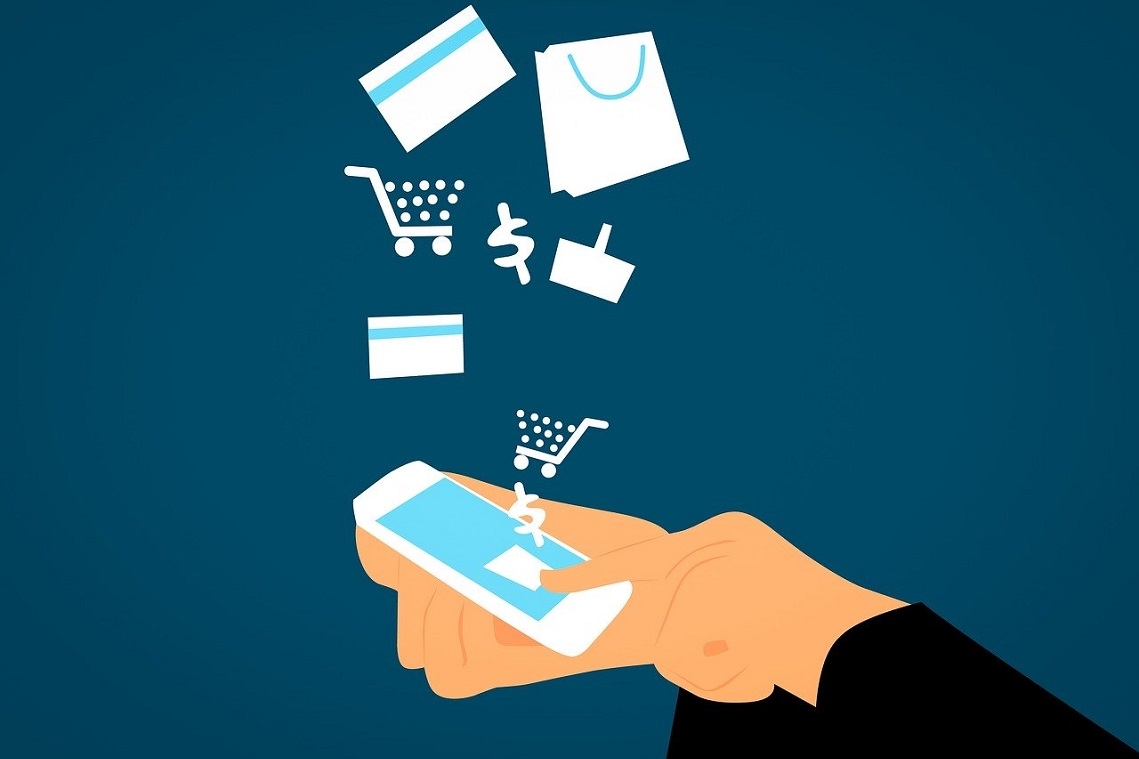
Οι περιορισμοί του κορονοϊού και η καραντίνα στην οποία μπαίνουν οι Έλληνες καταναλωτές, όπως αναμενόταν, εκτόξευσαν τα δεδομένα για τις online παραγγελίες και στη χώρα μας.
Όπως σημειώνει σε ρεπορτάζ του το enternity.gr, εκπρόσωποι του εγχώριου λιανεμπορίου ανέφεραν πως οι Έλληνες στράφηκαν ιδιαίτερα στο κομμάτι των ηλεκτρονικών καταστημάτων, κάνοντας τις παραγγελίες τους μέσω διαδικτύου και δημιουργώντας μια κατάσταση που θύμισε Black Friday 2019 σε επίπεδο όγκου και τζίρου.
Φαίνεται πως η κατάσταση αυτή θα συνεχιστεί για αρκετό ακόμη διάστημα, αφού τα καταστήματα λιανικής θα δέχονται στο εξής παραγγελίες μόνο online, άγνωστο για πόσο, εφόσον θα είναι κλειστά από σήμερα, Τετάρτη, 18 Μαρτίου, κατόπιν της σχετικής απόφασης της ελληνικής κυβέρνησης.
Εικόνα: mohamed Hassan, Pixabay
[social_share googleplus="no" linkedin="yes" whatsapp="no" viber="no"]

Από τον GR.EC.A ανακοινώθηκε πως η Εβδομάδα Ηλεκτρονικού Εμπορίου αναβάλλεται και η νέα ημερομηνία διεξαγωγής της θα ανακοινωθεί όταν η τρέχουσα κατάσταση ομαλοποιηθεί. Ακολουθεί το κείμενο της ανακοίνωσης.
"Η κατάσταση που έχει διαμορφωθεί τις τελευταίες ημέρες λόγω του COVID-19, έχει δημιουργήσει για όλους μας νέα δεδομένα, εξαιτίας των μέτρων που έχει χρειαστεί να ληφθούν – και όσων ενδέχεται να επακολουθήσουν με βάση τις εξελίξεις.
Σε αυτό το πλαίσιο, οφείλουμε να αναβάλλουμε τη δράση της Εβδομάδας Ηλεκτρονικού Εμπορίου που είχε προγραμματιστεί για την περίοδο 30 Μαρτίου έως 05 Απριλίου 2020.
Η νέα ημερομηνία της διεξαγωγής θα ανακοινωθεί από το Διοικητικό Συμβούλιο του GR.EC.A μόλις ομαλοποιηθεί η κατάσταση.
Παράλληλα, ο GR.EC.A βρίσκεται σε επικοινωνία με όλους τους αρμόδιους φορείς, προκειμένου να έχει πλήρη εικόνα των εξελίξεων για την ενημέρωση των μελών του."
[social_share googleplus="no" linkedin="yes" whatsapp="no" viber="no"]
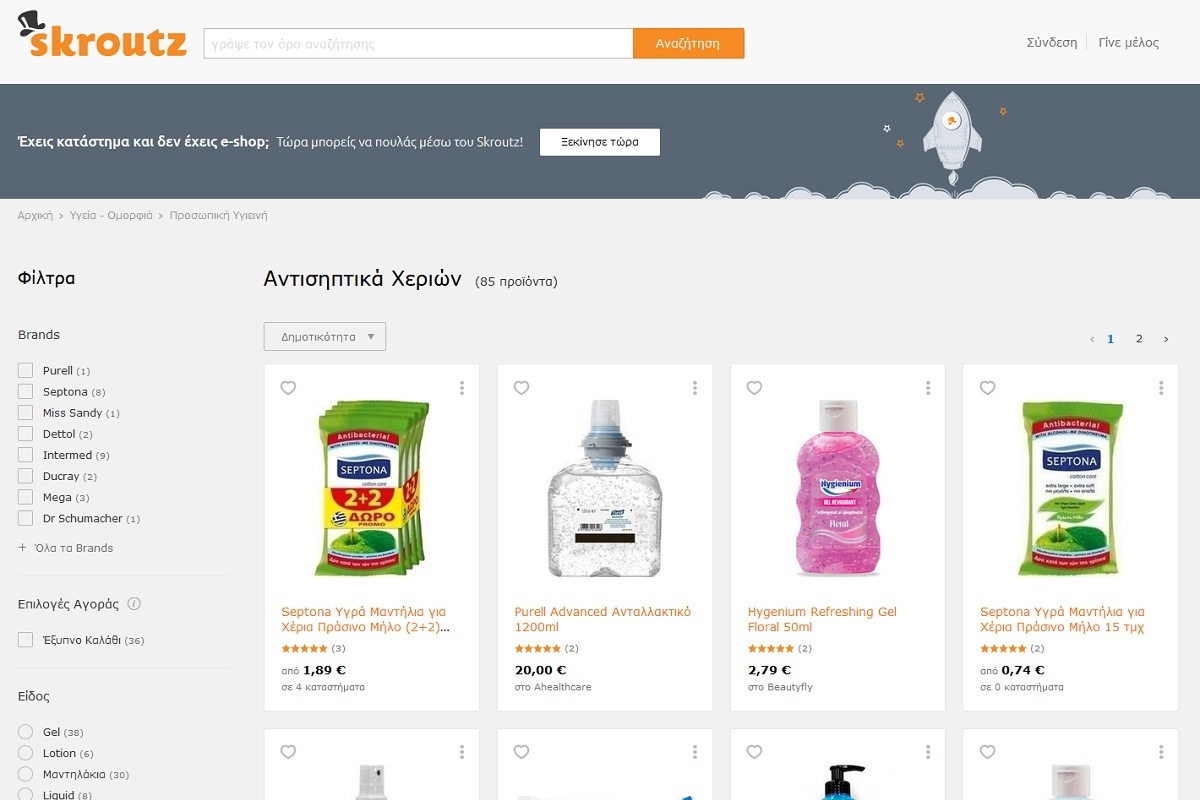
Στη διακοπή τής συνεργασίας του προχωρά το Skroutz.gr με όσα ηλεκτρονικά καταστήματα έχουν αυξήσει υπερβολικά τις τιμές τους σε προϊόντα, με αφορμή την εξάπλωση του κορονοϊού, σύμφωνα με δημοσίευμα του News247.
Σύμφωνα με όσα ανέφερε εκπρόσωπος της Skroutz στο News24/7, η κίνηση αφορά αρκετά προϊόντα όπως ιατρικές μάσκες και απολυμαντικά. Από δική μας έρευνα, είναι χαρακτηριστικό πως μάσκα μίας χρήσης, από 2,99 ευρώ που ήταν η "κανονική" της τιμή, έφτασε να πωλείται 17 ευρώ, σε ηλεκτρονικό κατάστημα με έδρα τη Θεσσαλονίκη.
Η εταιρεία ειδοποίησε τους συνεργάτες της για την πρόθεσή της και σε όσους δεν συμμορφώθηκαν προχώρησε σε αναστολή της συνεργασίας. Η Skroutz δεν έχει αποφασίσει τι στάση θα ακολουθήσει στο μέλλον με τις συγκεκριμένες εταιρείες και αν θα τις εντάξει ξανά στην πλατφόρμα.
Πριν από μερικές ημέρες, η Amazon με ανακοίνωσή της είχε προχωρήσει σε αντίστοιχη κίνηση, αφαιρώντας από την πλατφόρμα της 530.000 προϊόντα, των οποίων οι τιμές είχαν αυξηθεί αδικαιολόγητα, ενώ είχε αναστείλει και την λειτουργία σε περισσότερους από 2.500 λογαριασμούς προμηθευτών.
[social_share googleplus="no" linkedin="yes" whatsapp="no" viber="no"]
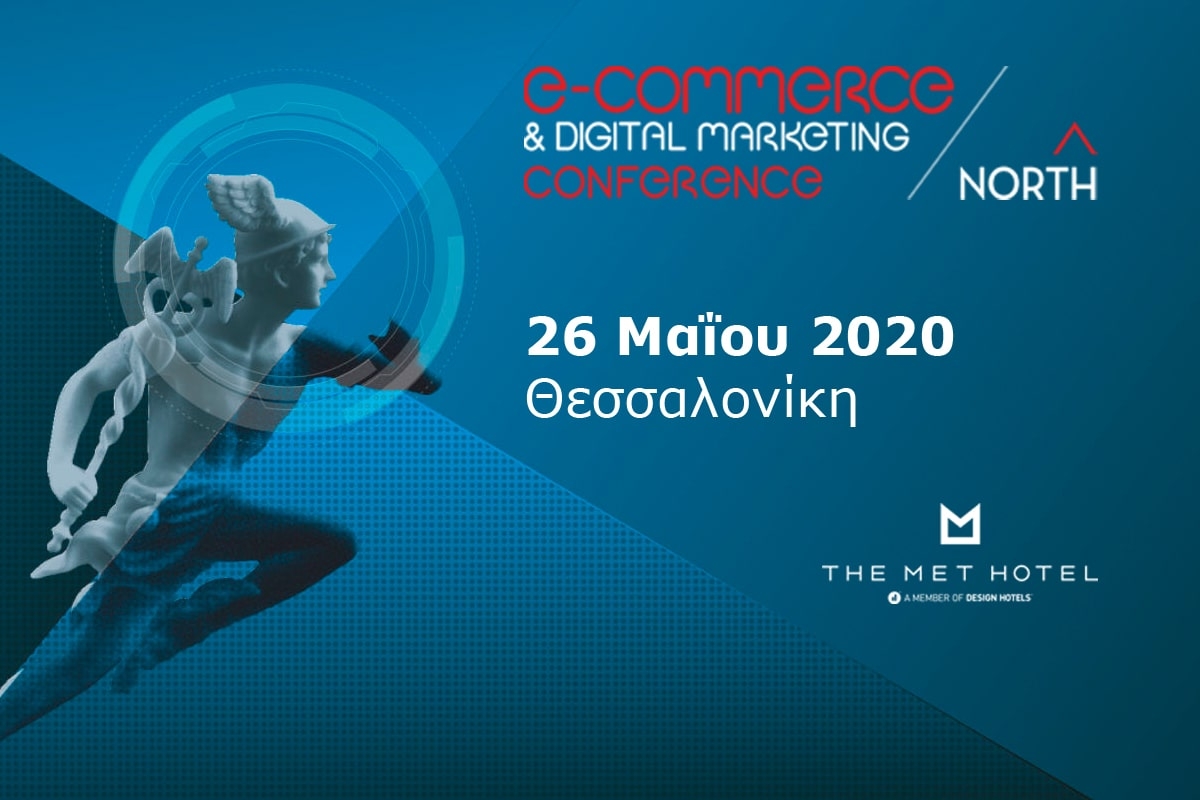
Νέα ημερομηνία διεξαγωγής ανακοινώθηκε από τους διοργανωτές για το eCommerce & Digital Marketing Conference North, 2020.
Η συνεδριακή εκδήλωση, η οποία θα συνδυαστεί με εκθεσιακή παρουσία εταιρειών, μετατέθηκε από τις 8 Απρίλιου, για την 26η Μαΐου εξαιτίας των ειδικών συνθηκών που διαμορφώθηκαν με την έλευση του κορωνοϊού.
Το επίσημο Web site του ECDM Conference North 2020 περιέχει όλες τις απαραίτητες πληροφορίες για επισκέπτες και συμμετέχουσες εταιρείες, χορηγούς και εκθέτες. Επίσης, είναι διαθέσιμοι οι μηχανισμοί εγγραφής των επισκεπτών του ECDM Conference North 2020, όσον αφορά στον εκθεσιακό του χώρο, όπου η επίσκεψη είναι δωρεάν, αλλά και όσων ενδιαφέρονται να παρακολουθήσουν το συνέδριο για το Ηλεκτρονικό Εμπόριο και το Ψηφιακό Μάρκετινγκ, που θα διεξαχθεί στο πλαίσιο της διοργάνωσης.
Το συνέδριο χωρίζεται σε τέσσερις θεματικές ενότητες, eCommerce Platforms, Digital Marketing, Digital Payments, Shipments & Logistics και έχει στόχο να παρουσιάσει στο κοινό της Βόρειας Ελλάδας τις βέλτιστες πρακτικές από εγχώρια και διεθνή επιτυχημένα project και όλες τις μοντέρνες υπηρεσίες και προϊόντα για το Ηλεκτρονικό Επιχειρείν: υποδομές ηλεκτρονικών καταστημάτων, ψηφιακή διαφήμιση, ηλεκτρονικές πληρωμές και ταχυμεταφορές.
Το κόστος του κανονικού εισιτηρίου είναι 55 ευρώ πλέον ΦΠΑ. Για τα μέλη του GRECA προβλέπεται μειωμένο εισιτήριο με κόστος 40 ευρώ πλέον ΦΠΑ. Τέλος, για όσους κλείσουν το εισιτήριό τους έως τις 24 Απριλίου, προβλέπεται μειωμένο κόστος, στα 40 ευρώ πλέον ΦΠΑ.
Στην τιμή του εισιτηρίου για το συνέδριο, συμπεριλαμβάνονται, εκτός από τη συμμετοχή, 1 διάλειμμα για καφέ και υλικό συνεδρίου (τσάντα, στυλό, σημειωματάριο).
Η είσοδος στον εκθεσιακό χώρο του ECDM Expo Conference North 2020 είναι δωρεάν. Το μόνο που χρειάζεται για την επίσκεψη στον εκθεσιακό χώρο, είναι μία δωρεάν εγγραφή στη φόρμα επισκεπτών που υπάρχει στο ecdmexpo.com.
Χώρος διεξαγωγής: THE MET HOTEL, Θεσσαλονίκη.
Χρόνος διεξαγωγής: 26 Μαΐου 2020.
Περισσότερες πληροφορίες: www.ecdmexpo.com
[social_share googleplus="no" linkedin="yes" whatsapp="no" viber="no"]

Οπαδοί των ψηφιακών αγορών γίνονται όλο και περισσότεροι Έλληνες καταναλωτές. Τους τελευταίους 12 μήνες, το 26% των Ελλήνων πολιτών έκανε τουλάχιστον μία online αγορά από χώρα-μέλος της Ευρωπαϊκής Ένωσης (οι αγορές δεν αφορούν ψηφιακό περιεχόμενο, όπως μουσική, βίντεο, ηλεκτρονικά βιβλία, εφαρμογές ή παιχνίδια).
Πάντως, ένα μεγάλο ποσοστό των καταναλωτών στην Ελλάδα και συγκεκριμένα το 74% απαντά ότι δεν έχει κάνει κάποια ηλεκτρονική αγορά (εκτός από ψηφιακό περιεχόμενο) από κράτος-μέλος της Ε.Ε. τους τελευταίους 12 μήνες. Σε επίπεδο Ε.Ε., το 36% των Ευρωπαίων πολιτών δηλώνει ότι έχει κάνει τουλάχιστον μία online αγορά από κράτος της Ε.Ε. τους τελευταίους 12 μήνες, ενώ το 63% απαντά αρνητικά στην παραπάνω ερώτηση.
Τα παραπάνω στοιχεία περιλαμβάνονται σε ειδική έρευνα του Ευρωβαρομέτρου, η οποία διερευνά τη στάση των Ευρωπαίων καταναλωτών, σε σχέση με την ψηφιοποίηση της καθημερινής τους ζωής. Για παράδειγμα, η μελέτη δείχνει ότι οι Ευρωπαίοι θέλουν οι ψηφιακές συσκευές τους να είναι ευκολότερες στην επισκευή ή την ανακύκλωση.
Ειδικότερα, σχεδόν 8 στους 10 ερωτηθέντες πιστεύουν ότι θα πρέπει να απαιτείται από τους κατασκευαστές να διευκολύνουν την επισκευή των ψηφιακών τους συσκευών. Σε ερώτηση της έρευνας “Πρέπει να είναι υποχρεωμένοι οι κατασκευαστές να διευκολύνουν την επισκευή ψηφιακών συσκευών ή να αντικαθιστούν μεμονωμένα εξαρτήματά τους”, το 54% των Ευρωπαίων απαντά “ναι, δεδομένου ότι οι συσκευές δεν κοστίζουν περισσότερο”. Μάλιστα, ένα ποσοστό 24% απαντά “ναι, ακόμη και εάν οι συσκευές κοστίζουν περισσότερο”.
Η έρευνα ανατέθηκε από τη Γενική Διεύθυνση Επικοινωνίας της Ευρωπαϊκής Επιτροπής για τα Δίκτυα, το Περιεχόμενο και την Τεχνολογία. Διεξήχθη από το δίκτυο Kantar σε 27.498 ερωτηθέντες από διαφορετικές κοινωνικές και δημογραφικές ομάδες σε προσωπικές συνεντεύξεις στη μητρική τους γλώσσα τον Δεκέμβριο του 2019.
Δείτε περισσότερα στο sepe.gr.
[social_share googleplus="no" linkedin="yes" whatsapp="no" viber="no"]

Η Εβδομάδα Ηλεκτρονικού Εμπορίου αποτελεί τη μεγαλύτερη γιορτή του Ελληνικού eCommerce, και διοργανώνεται για έβδομη χρονιά από τον Ελληνικό Σύνδεσμο Hλεκτρονικού Εμπορίου (GR.EC.A) ενώ τελεί υπό την αιγίδα του Υπουργείου Ανάπτυξης και Επενδύσεων. Φέτος, η περίοδος εορτασμού είναι από τη Δευτέρα 30 Μαρτίου 2020 έως την Κυριακή 5 Απριλίου 2020.
Η συμμετοχή στην Εβδομάδα Ηλεκτρονικού Εμπορίου είναι ανοικτή και δωρεάν για όλα τα Ελληνικά Ηλεκτρονικά Καταστήματα και παρόχους υπηρεσιών που θέλουν να συμμετέχουν στις δράσεις του Ελληνικού Συνδέσμου Ηλεκτρονικού Εμπορίου (ΕΣΗΕ) και να γιορτάσουν με τους πελάτες τους, αναδεικνύοντας το θεσμό. Δικαίωμα συμμετοχής έχουν τα ηλεκτρονικά καταστήματα και οι πάροχοι υπηρεσιών οι οποίοι δεν είναι μέλη του Συνδέσμου.
Στόχος της Εβδομάδας είναι να δοθεί ένα επιπλέον κίνητρο στους καταναλωτές να ψωνίζουν διαδικτυακά, δείχνοντάς τους τα πλεονεκτήματα των online αγορών, καθώς επίσης δίνοντας βαρύτητα στην εκπαίδευση και ενημέρωσή τους για τα θέματα που τους απασχολούν και τους προβληματίζουν.
Κατά το διάστημα αυτό, πλήθος ελληνικών ηλεκτρονικών καταστημάτων παρέχει ελκυστικές προσφορές προς το καταναλωτικό κοινό, προτρέποντάς το να “βιώσει” την online αγοραστική εμπειρία.
Επίσης, κατά τη διάρκεια της εβδομάδας, διοργανώνονται δράσεις που απευθύνονται στα e-shops, με βασικό στόχο την εκπαίδευση και ενημέρωσή τους για τις νέες τάσεις που επικρατούν στον κλάδο.
Τα ενδιαφερόμενα καταστήματα, μπορούν να κάνουν την εγγραφή τους εδώ.
Το άρθρο περιλαμβάνει πληροφορίες από ανακοίνωση του GR.EC.A.
[social_share googleplus="no" linkedin="yes" whatsapp="no" viber="no"]

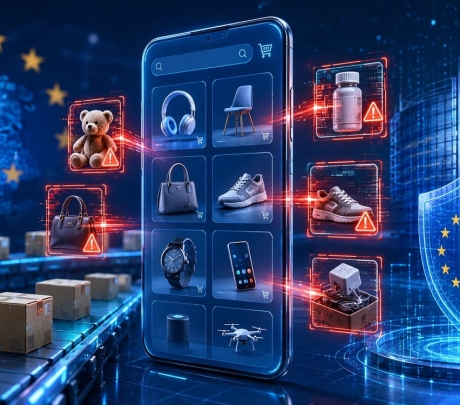
Τα δύο τρίτα των προϊόντων που αγοράστηκαν από τα AliExpress, Wish, LightInTheBox, eBay και Amazon απέτυχαν στις δοκιμές ασφαλείας, σύμφωνα με τα αποτελέσματα εκτεταμένης έρευνας που πραγματοποιήθηκε από έξι ενώσεις καταναλωτών στην Ευρώπη.
Για περισσότερο από ένα χρόνο, οι ενώσεις καταναλωτών, Which (Ηνωμένο Βασίλειο), Stiftung Warentest (Γερμανία), Altroconsumo (Ιταλία), Consumentenbond (Ολλανδία), Test Aankoop (Βέλγιο) και Forbrugerrådet Tænk (Δανία), παρήγγειλαν συνολικά 250 προϊόντα από τα πιο πάνω marketplaces, με σκοπό να εξετάσουν πόσο ασφαλή είναι. Από τα 250 που εξετάστηκαν, τα 165, δηλαδή ποσοστό 66% δεν πέρασαν τις σχετικές δοκιμές ασφαλείας.
Εξετάστηκαν 18 διαφορετικοί τύποι προϊόντων μέσω διαφορετικών τύπων συσκευών, και τα αποτελέσματα που προέκυψαν ήταν συγκλονιστικά. Για παράδειγμα, 7 στους 7 συναγερμούς ανίχνευσης μονοξειδίου του άνθρακα και 11 στους 12 αντάπτορες ταξιδιού απέτυχαν στις δοκιμές ασφαλείας.
Προϊόντα που απέτυχαν στις δοκιμές ασφαλείας
Η ένωση καταναλωτών «Which» του Ηνωμένου Βασιλείου εξέτασε τους συναγερμούς καπνού και CO που δεν μπόρεσαν να ανιχνεύσουν τον καπνό ή το μονοξείδιο του άνθρακα, τα χριστουγεννιάτικα λαμπάκια που θα μπορούσαν να προκαλέσουν ηλεκτροπληξία, τους φορτιστές USB και τους αντάπτορες ταξιδίου που θα μπορούσαν να προκαλέσουν πυρκαγιά και μια power bank που έλιωσε κατά τη διάρκεια των δοκιμών.
Οι υπόλοιπες ενώσεις καταναλωτών που αναφέρθηκαν παραπάνω βρήκαν προϊόντα λεύκανσης δοντιών με πολύ αυξημένη συγκέντρωση σε υπεροξείδιο του υδρογόνου, καλλυντικά που πωλούνται χωρίς την ετικέτα με τα συστατικά τους και παιδικά ρούχα επικίνδυνα για πνιγμό.
4 πράγματα που πρέπει να αλλάξουν
Μέχρι σήμερα, τα online καταστήματα και marketplaces δε φέρουν ευθύνη για την ασφάλεια των προϊόντων που πωλούνται μέσω της πλατφόρμας τους, ούτε και για την απόσυρση μη ασφαλών προϊόντων από την αγορά, ή την ενημέρωση των πελατών όταν κάτι πάει στραβά με ένα προϊόν.
Οι ενώσεις καταναλωτών της Ευρώπης θέλουν να αλλάξουν αυτό το καθεστώς, ώστε να διασφαλιστεί ότι οι καταναλωτές προστατεύονται επαρκώς όταν αγοράζουν από αυτά τα online καταστήματα. Για αρχή, θέλουν τα online καταστήματα να εξασφαλίζουν ότι τα προϊόντα που διαθέτουν είναι ασφαλή και να διευκρινιστούν τα βήματα που πρέπει να ακολουθούν όταν εντοπίζονται ανασφαλή προϊόντα.
Επίσης, οι αρμόδιοι για την επιβολή του νόμου θα πρέπει να διαθέτουν τους κατάλληλους πόρους, ερευνητικές δεξιότητες και πληροφορίες για την "αστυνόμευση" των ηλεκτρονικών αγορών και των δικτύων εφοδιασμού. Τέλος, θεωρείται απαραίτητη η ύπαρξη διαφάνειας, ώστε να είναι σαφές για τους καταναλωτές από ποιους αγοράζουν.
[social_share googleplus="no" linkedin="yes" whatsapp="no" viber="no"]
Η Αρχή Προστασίας Δεδομένων Προσωπικού Χαρακτήρα καλεί όλους τους υπευθύνους των παρόχων υπηρεσιών της κοινωνίας της πληροφορίας (ιστοτόπων, διαδικτυακών ιστοσελίδων, διαχείρισης cookies και συναφών τεχνολογιών κ.λπ.), να προσαρμοστούν το αργότερο μέσα στο επόμενο δίμηνο, στις ειδικές απαιτήσεις της νομοθεσίας για την επεξεργασία προστασίας των προσωπικών δεδομένων στις ηλεκτρονικές επικοινωνίες και στον Γενικό Κανονισμό Προστασίας Δεδομένων, GDPR.
Μάλιστα, η Αρχή, όπως αναφέρει, αφού διαπίστωσε την ύπαρξη ενός ικανού αριθμού ελλείψεων συμμόρφωσης, εξέδωσε κείμενο-κατάλογο σημείων με ειδικές συστάσεις συμμόρφωσης και καθοδήγησης για τη σύννομη χρήση τέτοιων τεχνολογιών, καθώς και τις πρακτικές που πρέπει να αποφεύγονται.
Τα μέλη του GR.EC.A μπορούν να απευθυνθούν για συμβουλευτικές υπηρεσίες στα Νομικά Γραφεία των μελών του συνδέσμου, που μπορούν να βρουν εδώ.
Διαβάστε εδώ ολόκληρη την ανακοίνωση της Αρχής Προστασίας Δεδομένων Προσωπικού Χαρακτήρα, η οποία περιέχει αναλυτικές πληροφορίες για τις βέλτιστες και τις κακές πρακτικές.
Το άρθρο περιλαμβάνει πληροφορίες από ανακοίνωση του GR.EC.A.
Εικόνα: Pete Linforth, Pixabay
[social_share googleplus="no" linkedin="yes" whatsapp="no" viber="no"]

Την ηλεκτρονική οδό για τις αγορές ειδών ένδυσης και υπόδησης επιλέγουν, όλο και πιο συχνά, οι Έλληνες καταναλωτές. Το 2019 το 65% των καταναλωτών προχώρησε σε συχνότερες αγορές ρούχων, παπουτσιών και αξεσουάρ από κάποιο ηλεκτρονικό κατάστημα σε σχέση με το 2018.
Σύμφωνα με την 3η έρευνα του GLAMI, της μηχανής αναζήτησης μόδας στην Ελλάδα, οι online αγορές μόδας αποτελούν πια μία από τις πλέον βασικές κατηγορίες του e-commerce στη χώρα μας. Όπως προκύπτει από τα ευρήματα της έρευνας, που διεξήχθη τον Νοέμβριο του 2019 με τη συμμετοχή 2.595 Ελλήνων χρηστών του Ιnternet, περισσότεροι από ένας στους δύο χρήστες χρησιμοποιούν κάποια εφαρμογή για κινητά (apps) καταστημάτων μόδας.
Ενδεικτικό της ψηφιοποίησης των αγορών και στον χώρο της μόδας, είναι ότι οι αγοραστές επηρεάζονται, πλέον, άμεσα από τα ψηφιακά κανάλια αξιολόγησης, όταν κάνουν μια αγορά. Για παράδειγμα, η έρευνα δείχνει ότι οι αρνητικές αξιολογήσεις και κριτικές άλλων χρηστών στη σελίδα του καταστήματος θα απέτρεπαν το 39,8% των ερωτώμενων από μία αγορά. Στον αντίποδα, η θετική αξιολόγηση, που επιβραβεύει τα καλά προϊόντα και υπηρεσίες, επηρεάζει θετικά τους αγοραστές.
Όσον αφορά το τί εκτιμούν ιδιαίτερα σε ένα ηλεκτρονικό κατάστημα, όταν αγοράσουν είδη μόδας, η έρευνα δείχνει ότι κομβικός είναι ο ρόλος της φωτογραφίας. Οι Έλληνες αναδεικνύουν την αναζήτηση βάσει φωτογραφίας ως το σημαντικότερο trend, όταν αγοράζουν προϊόντα μόδας online.
Δείτε περισσότερα στο sepe.gr.
[social_share googleplus="no" linkedin="yes" whatsapp="no" viber="no"]
Πρόσφατα άρθρα


Follow Us


Πρόσφατα άρθρα eCommerce

Δημοφιλή άρθρα


See also from Verticom
News Portals
Categories Menu
Site Menu
Κόμβος πληροφόρησης για θέματα και εφαρμογές που αφορούν στις ψηφιακές τεχνολογίες και το Ηλεκτρονικό Επιχειρείν.
Stay in Touch
Εγγραφή στο WWN Weekly
Διεύθυνση εταιρείας
Ευμολπιδών 23
118 54, Αθήνα
Γενικές πληροφορίες
info@verticom.gr
(+30) 210 924 55 77